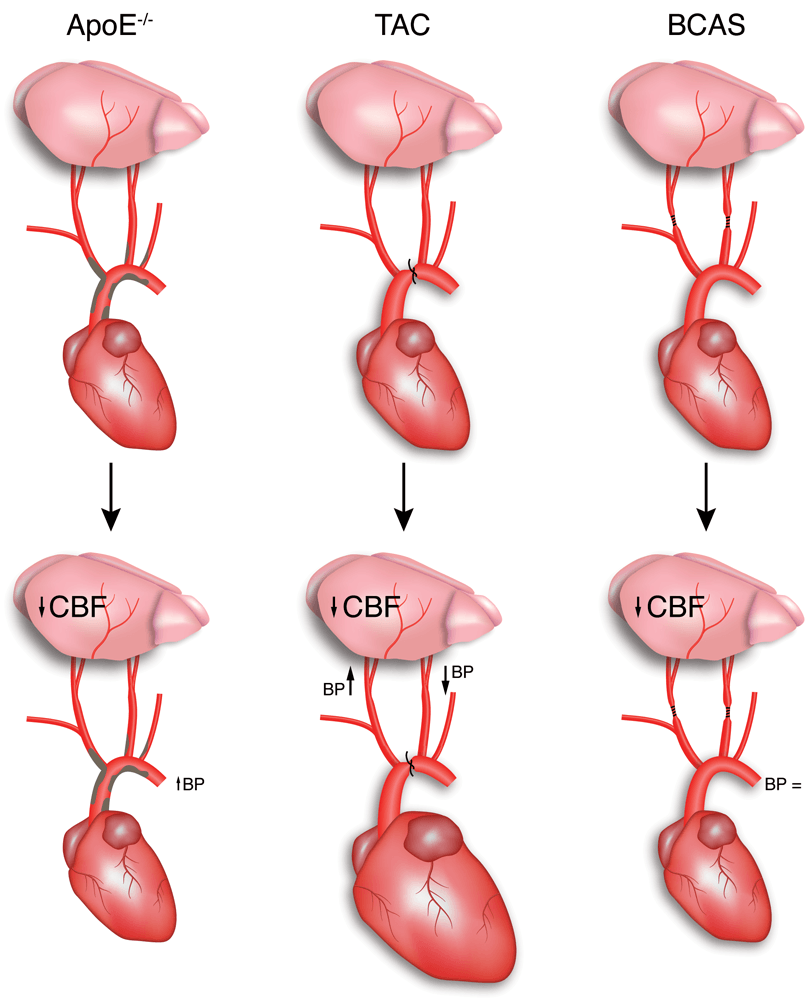
Chapter 2 Figure 1Most commonly used models for atherosclerosis, heart failure and hypoperfusion to study the effect of cardiovascular risk factors on the brain.

Chapter 2 Figure 2Proposed flow chart of disease progression primarily based on experimental data of the BCAS and TAC model. As not a lot of successive studies have been performed, no clear distinction between cause and result of the different factors can be made.
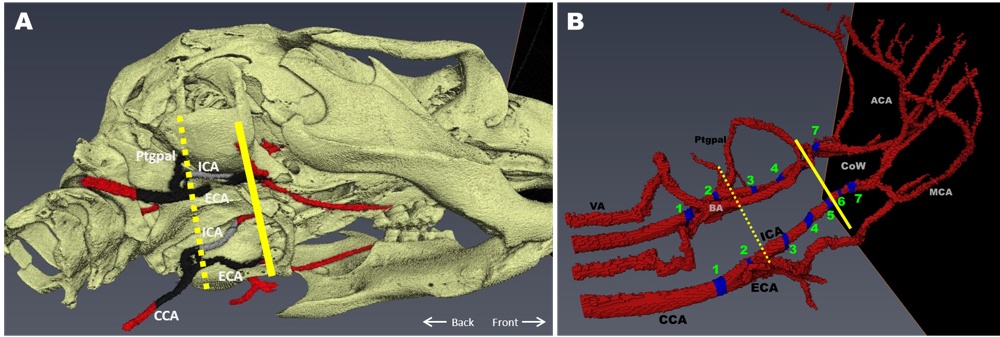
Chapter 3 Figure 1Three-dimensional reconstruction of the peripheral and cerebral arterial tree. A, CT scan showing a slightly ventrolateral view of the skull and vessels. The dashed line indicates where the atherosclerotic plaques stop in most mice. The continuous line indicates the place where the ICA enters the skull. Red indicates part of the vessels without atherosclerosis. The black indicates the part of the vessels with extensive atherosclerosis (based on 32 mice). The gray indicates atherosclerosis as observed only in one mouse. B, Magnetic resonance angiogram showing the sagittal view of the mouse arterial tree from common carotid artery (CCA) to the circle of Willis (CoW) and its main branches. The numbered blue areas indicate the areas in which immunohistochemistry sections were taken.

Chapter 3 Figure 2Representative picture of the first transition point of the internal carotid artery (ICA) at the bifurcation (bif) with the pterygopalatine artery (Ptgpal) where the atherosclerotic lesion usually stopped in a 26 week old ApoE-/-Fbn1C1039G+/- mouse on WD. An atherosclerotic plaque containing a necrotic core with foamy macrophages is shown in the ICA on the rostral site of the bifurcation. There was no plaque at the cranial site of the bifurcation, the site of the vessel that is heading towards brain. In the left panel (2,5x) an overview is shown of the bifurcation of the ICA and Ptgpal, while the right panel (10x) shows the first transition point in more detail with the atherosclerotic core outlined with a black line.

Chapter 3 Figure 3Changes in vessel wall morphology in C57Bl/6 mice from the common carotid artery (CCA) to the intracranial part of the internal carotid artery (ICA) (n=6). A-D, Vessel wall thickness of the intima and media was measured in the HE staining. Amount of elastic fibers in the Elastica van Gieson (EvG) staining (E-H) and Icam-1 positive staining (M-P) decreased, while the amount of SMA (I-L), claudin-5 (Q-T), HO-1 (U-X) and NQO1 (Y-AB) increased from the CCA bifurcation site to the intracranial part of the ICA (63x magnification). Numbers on the x-axis indicate the position in the vessels as shown in figure 1B. Dashed lines indicate the first transition point of the ICA bifurcation with the Ptgpal where atherosclerosis stopped in most animals. Continuous lines indicate the second transition point and entry of the ICA in the skull. Statistical significance was determined by Friedman test and considered statistical significant if p<0.05.
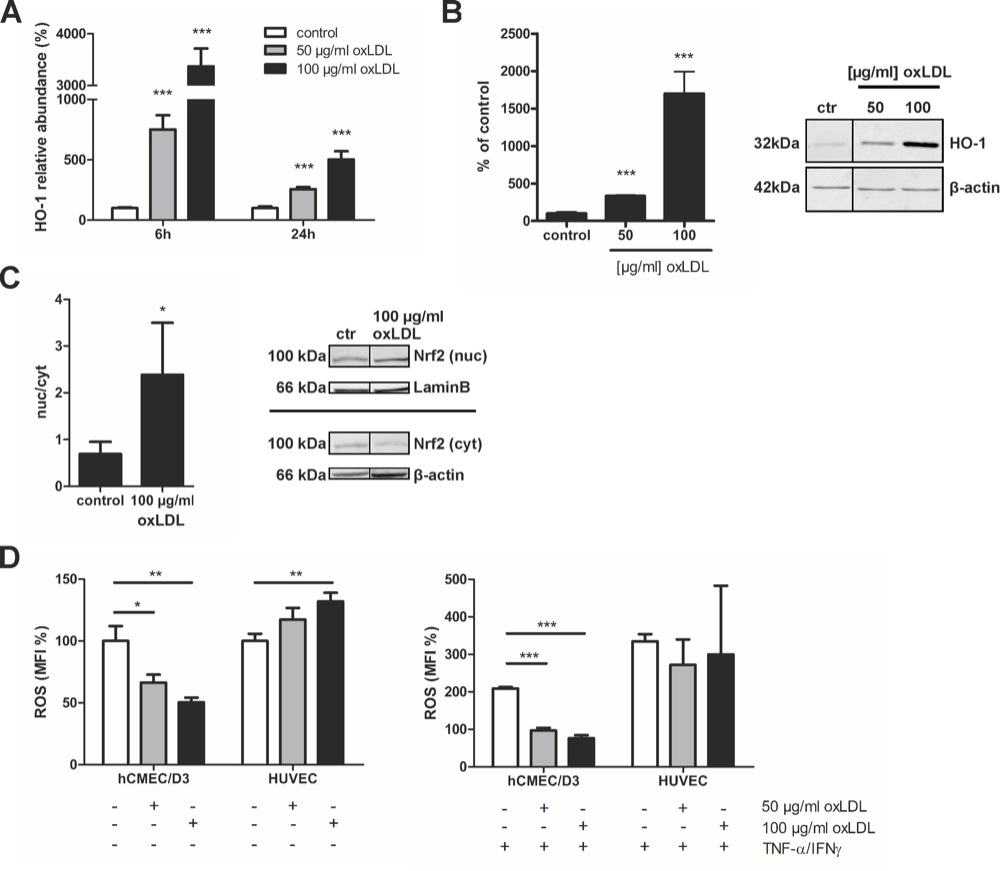
Chapter 3 Figure 4oxLDL protects brain endothelial (hCMEC/D3) cells from oxidative stress. A, HO-1 expression levels are increased after 6 and 24h (n=4). B, Quantification of HO-1 protein expression as measured by western blot, corrected for actin (n=3). C, Western blot analysis of nuclear and cytoplasmic fractions of brain endothelial cells corrected for laminB and β-actin, respectively, showed an increased nuclear presence of Nrf2 (n=4). D, oxLDL significantly reduced brain endothelial reactive oxygen species (ROS) production in untreated and immune-activated (TNFα/IFNγ) conditions (n=3). Expression data are presented as means ± SD. ROS production is presented as median fluorescent intensity (MFI) percentage compared to control ± SD. Statistical significance was determined by two-tailed Student’s t-test. *p < 0.05, **p < 0.001, ***p < 0.0001.

Chapter 4 Figure 1Structure of the blood-brain barrier (BBB). The BBB is located at two main interfaces, between the blood and the brain, the BBB proper (A) and between the blood and the cerebrospinal fluid (CSF), the blood-CSF-barrier (BCSFB) (B). The BBB proper is formed by capillary endothelial cells that are tightly held together by tight junctions. The BCSFB lies at the choroid plexus of the lateral, third and fourth ventricle of the brain, which is formed by tight junctions between the epithelial cells facing the CSF. Both structures are supported by a basement membrane (red), composed of ECM molecules such as laminin, collagen IV, proteoglycans and microfibrils, mainly composed of fibrillin-1.

Chapter 4 Figure 3Xanthomas in the brain of ApoE-/-Fbn1C1039G+/- mice. (A-C) MRI of the brain of an ApoE-/-Fbn1C1039G+/- mouse on WD for 17 weeks (axial (A), sagittal (B) and coronal (C) plane). Lesions are encircled in white. (D-F) Histological evaluation of the lesion detected by MRI. Brain lesions are composed of cholesterol clefts (asterisks) and foam cells (arrowheads), typical of xanthomas. (E) Magnification of box in (D); (F) magnification of box in (E). Scale bar=1mm (D) and 50µm (E, F).

Chapter 4 Figure 4Xanthomas in ApoE-/-Fbn1C1039G+/- mice are mainly observed in the brain ventricles and in the neocortex, as shown by MRI. (A) Lateral ventricle (B) third ventricle (C) fourth ventricle and (D) neocortex.
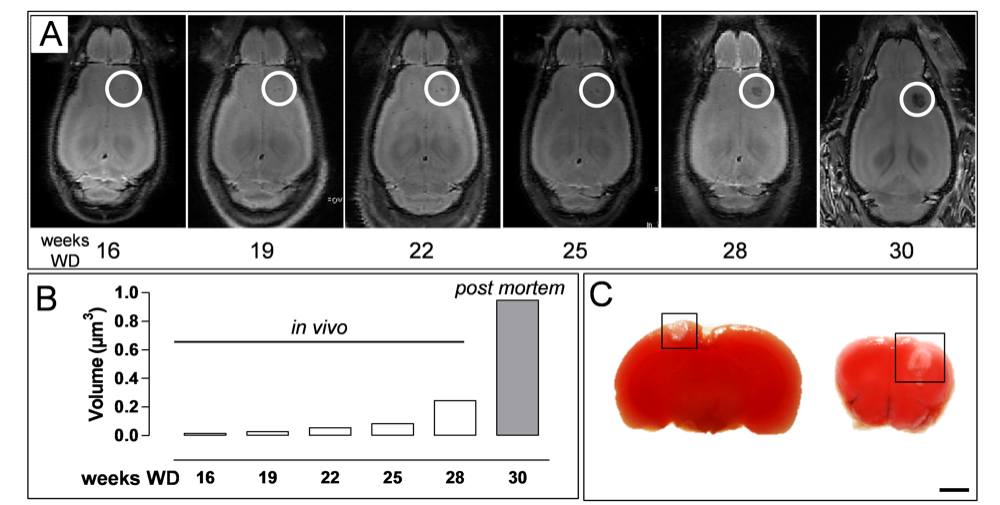
Chapter 4 Figure 5Xanthomas increase in size over time and do not induce brain hypoxia. (A) Longitudinal MRI study of the brain of an ApoE-/-Fbn1C1039G+/- mouse on WD for up to 30 weeks. Lesions were detected after 16 weeks on WD and increased exponentially in size over time (R2=0.98). (B) Quantification of xanthoma growth in the brain of mouse in (A). Weeks 16-28 on WD in vivo and high resolution post mortem MRI at 30 weeks on WD. (C) Two examples of a TTC stain of brains of ApoE-/-Fbn1C1039G+/- mice showing a xanthoma (boxed area) in the neocortex. Hypoxia was absent in the proximity of the xanthomas. Scale bar=200µm.
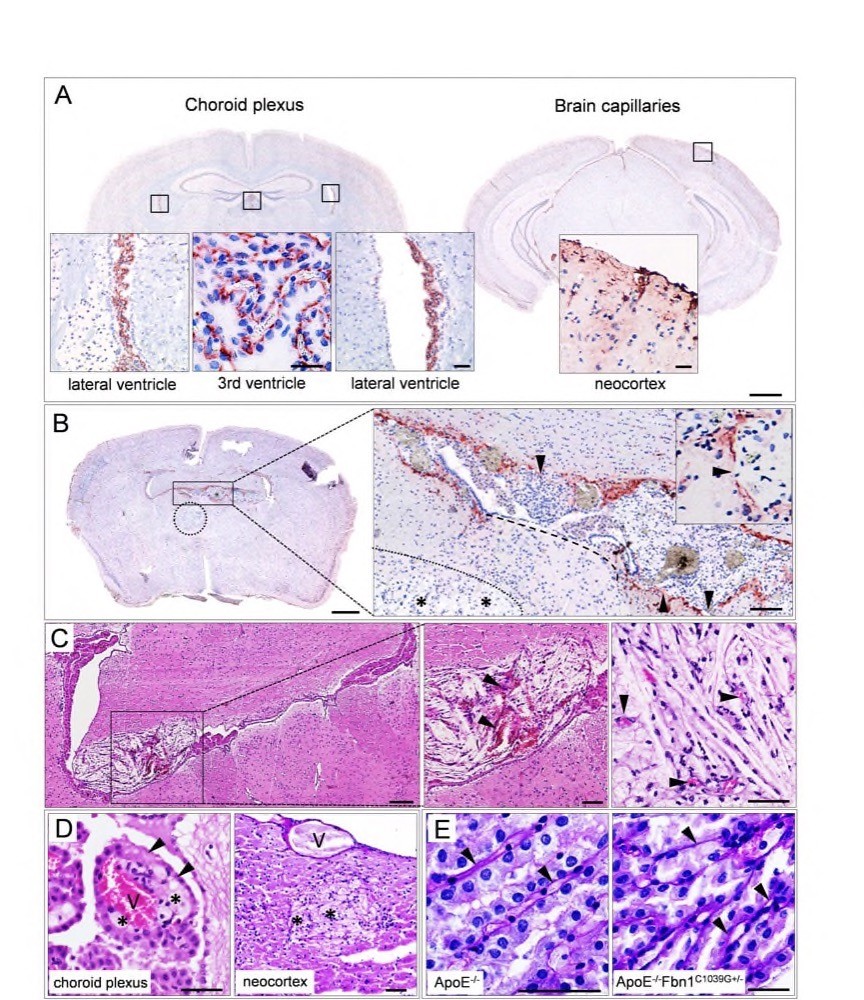
Chapter 4 Figure 6Fibrillin-1 is expressed in the choroid plexus and capillaries of the neocortex, corresponding with the capillary basement membrane. (A) Brain sections showing presence of fibrillin-1 in the choroid plexus of the lateral and third ventricles (left hand panel) and capillaries of the neocortex (right hand panel). (B) Fibrillin-1 stain showing that in the presence of a xanthoma, the choroid plexus appears damaged and fenestrated (arrowheads in the high magnification image) or even completely disappears (dashed line), allowing the growth of the lesion into the parenchyma (xanthomas are indicated with dotted lines, foam cells and cholesterol clefts with asterisks). (C) HE stain showing haemorrhage (arrowheads) and small blood vessels in a xanthoma in the lateral ventricle (left hand and middle panel) and neocortex (right hand panel), respectively. (D) Early development of a xanthoma in the choroid plexus. Foam cells (asterisks) are observed around a (capillary) vessel (V) in the choroid plexus, damaging the epithelium (arrowheads, HE stain, left hand panel). The right hand panel shows the extravasation of foam cells adjacent to a blood vessel in the neocortex (PAS stain). (E) PAS stain showing an organized (ApoE-/-, left hand panel) or damaged (ApoE-/-Fbn1C1039G+/-, right hand panel) structure of the choroid plexus. The basement membrane (arrowheads) appears to be thicker in ApoE-/-Fbn1C1039G+/- compared to ApoE-/-mice. Scale bar=50µm (high magnification images in A and C, D, E), 200µm (B, C) and 1mm (low magnification brain images in A, B).
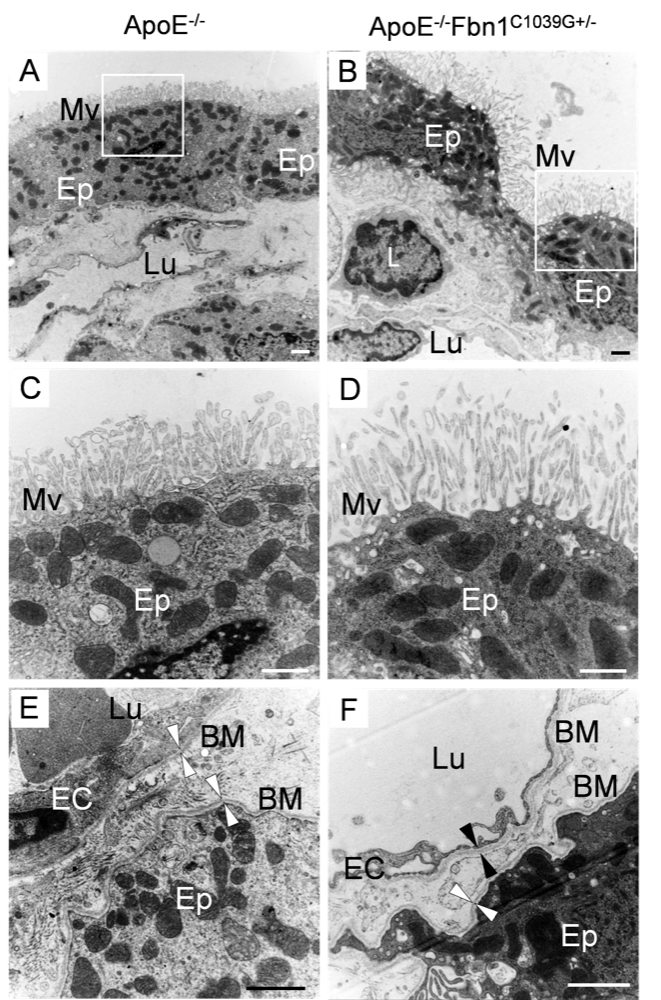
Chapter 4 Figure 7Morphological changes in the choroid plexus of ApoE-/-Fbn1C1039G+/- mice on TEM. In contrast to the adjacent and cubic epithelial cells of ApoE-/- mice (A), the epithelial cells of ApoE-/-Fbn1C1039G+/- mice appeared flattened and detached and showed ‘stretched’ microvilli at their surface (B). In ApoE-/-Fbn1C1039G+/- mice, leukocytes (L) were often observed adherent to the choroid plexus endothelium or even migrated into the choroid plexus parenchyma, having crossed the fenestrated endothelium and basement membrane (B). (C, D) Detail of the microvilli on the epithelial cells in (A, B). The microvilli on the epithelial cells of ApoE-/-Fbn1C1039G+/- mice appeared less dense and stretched compared to those of ApoE-/- mice. (E, F) Detail of the basement membrane (arrowheads, BM) in an ApoE-/- (E) and an ApoE-/-Fbn1C1039G+/- mouse (F). Ep=epithelial cell, Mv=microvilli, Lu=lumen of blood capillary, L=leukocyte, EC=endothelium, BM=basement membrane. Scale bar=1 µm.
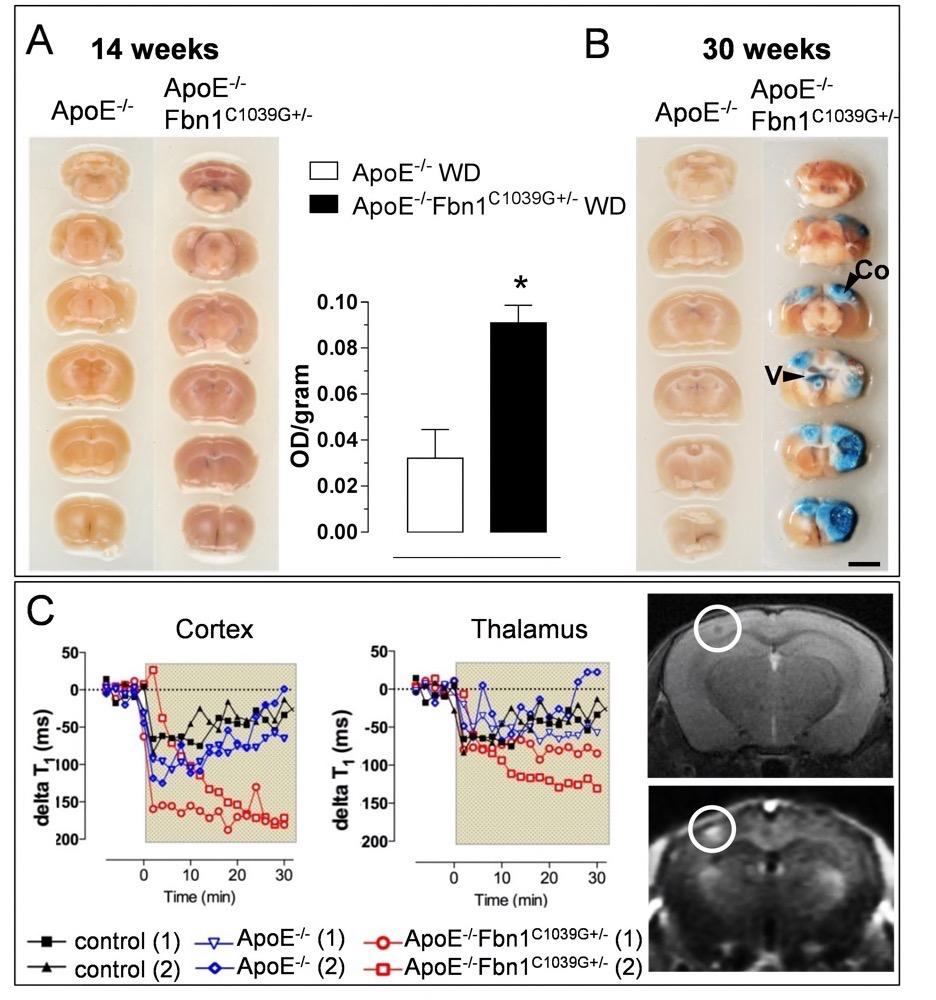
Chapter 4 Figure 2Increased BBB/BCSFB permeability in ApoE-/-Fbn1C1039G+/- mice. (A) After 14 weeks on WD, a significant Evans blue leakage is observed in brains of ApoE-/-Fbn1C1039G+/- compared to ApoE-/- mice (spectrophotometric quantification in the right hand panel). (B) After 30 weeks on WD, ApoE-/-Fbn1C1039G+/- mice show impressive lesions in large areas of (neo)cortex (Co) and brain ventricles (V), which are associated with extensive Evans blue leakage, pointing toward a breakdown of the BBB/BCSFB. Different gradients of Evans blue are observed in the lesions (n=4 per group, P=0.018, unpaired Student’s t-test). Spectrophotometric quantification of Evans blue at 30 weeks could not be performed due to the large presence of lesions (lipids), interfering with the measurement. (C) Gadolinium (Gd)- enhanced MRI at 21 weeks on WD showed an increased drop in delta T1 values in ApoE-/-Fbn1C1039G+/- mice (red) compared to ApoE-/- (blue) and WT control mice (black). (1) and (2) represent two different mice, representative of each group. Gd leakage was more pronounced in the neocortex of ApoE-/-Fbn1C1039G+/- mice and peaked in the presence of a lesion (white circle).Right hand panel: upper T2 and lower T1-weighted image.
***P<0.001, **P<0.01 vs. ApoE-/-Fbn1C1039G+/- with xanthoma (One-way ANOVA followed by Bonferroni’s post-hoc test) and $$$P<0.001; $$P<0.01; $P<0.05 ApoE-/-Fbn1C1039G+/- vs. ApoE-/- at the same age (Two-way ANOVA followed by Tukey’s post-hoc test). X= choroid plexus with xanthomas.
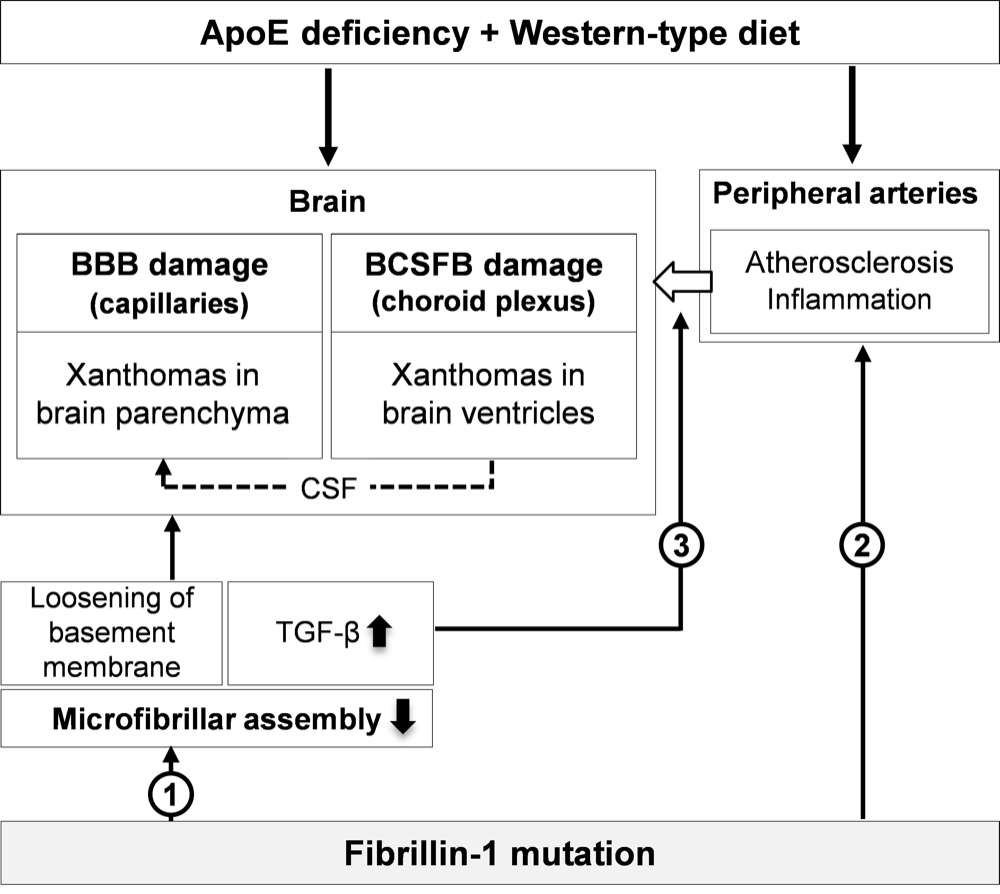
Chapter 4 Figure 9Mechanism of accelerated xanthoma formation in the brain of ApoE-/-Fbn1C1039G+/- mice. The ApoE-/- background together with a WD initiates BBB and BCSFB degradation. The BBB damage at the level of the capillaries and the BCSFB damage at the choroid plexus facilitate the entry of leukocytes and lipoproteins in the brain, promoting the development of xanthomas in the brain parenchyma and brain ventricles, respectively. The fibrillin-1 mutation potentiates xanthoma formation at three different levels: (1) by causing a decreased assembly of the microfibrils in the basement membrane, making it more loose, (2) by accelerating peripheral inflammation (atherosclerosis), stimulating the entry of leukocytes in the brain and (3) by increasing the (local) expression of the inflammation regulator TGF-β, promoting local inflammation and matrix degradation. In addition, due to the severe damage of the choroid plexus in ApoE-/-Fbn1C1039G+/- mice, CSF may be enriched with lipoproteins and activated leukocytes, leading to xanthoma formation in the parenchyma of e.g. the olfactory bulb, brain stem and cerebellum (dashed line).
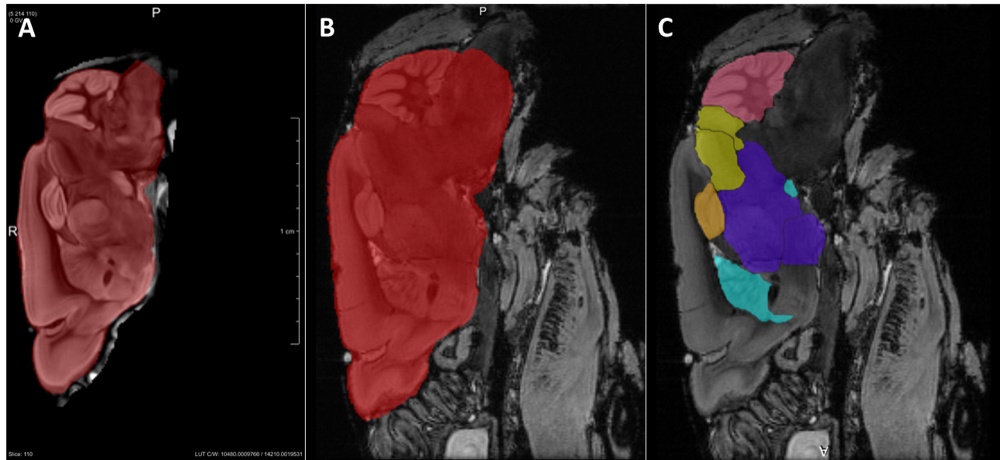
Chapter 5 Figure 1Ex vivo 3D imaging of the mouse brain with MRI and GT-DOTA contrast. The template brain in the sagittal imaging plane with whole brain label is shown in red (A). The labels were propagated to each of the registered individual datasets. Examples are shown for the whole brain (B), cerebellum (pink), colliculus (yellow), hippocampus (orange), combined thalamus and hypothalamus (purple) and basal ganglia (light blue) (C).

Chapter 5 Figure 2A cortical infarct was identified in one of the ApoE-/- mice. An overview of the HE staining of the cortex is shown in (A)(2,5x) and in more detail (10x) the HE (B), GFAP (C) and Iba-1 (D) stainings are shown.

Chapter 5 Figure 3Histological cerebral changes in ApoE-/- mice. Representative images and statistics are shown of white matter marker MBP (A-C), BBB leakage marker IgG (D-F), tight-junction marker Claudin-5 (G-I) and endothelial activation marker ICAM-1 (J-L) in ApoE-/- mice (B,E,H,K) compared to C57Bl/6 mice (A,D,G,J). x p<0.05.
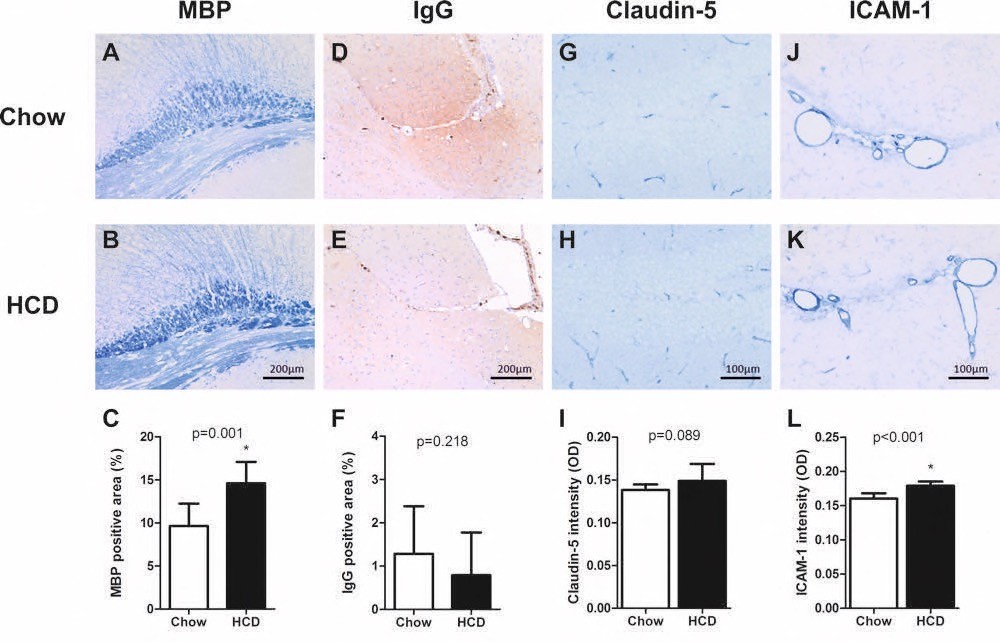
Chapter 5 Figure 4Histological cerebral changes in ApoE*3L.CETP mice on HCD. Representative images and statistics are shown of white matter marker MBP (A-C), BBB leakage marker IgG (D-F), tight-junction marker Claudin-5 (G-I) and endothelial activation marker ICAM-1 (J-L) analyses in ApoE*3L.CETP chow fed mice (A, D, G, J) compared to HCD mice (B, E, H, K). x p<0.05.

Chapter 6 Figure 1Survival curves of MI C57Bl/6 (A), MI APP/PS1 (B), TAC LDLr-/- (C), BCAS 0.20 mm C57Bl/6 (D) and BCAS 0.20 mm LDLr-/- mice (E). The dotted line indicates the 6w MRI scan time-point, the dashed line indicates the 12w time-point. Numbers in the graphs indicate the number of animals at the start of the experiment (left) and animals at the end of the experiment before (right, above) and after (right, below) MRI scans. BCAS LDLr-/- mice had to be sacrificed at 6-7 weeks after surgery due to skin infections.
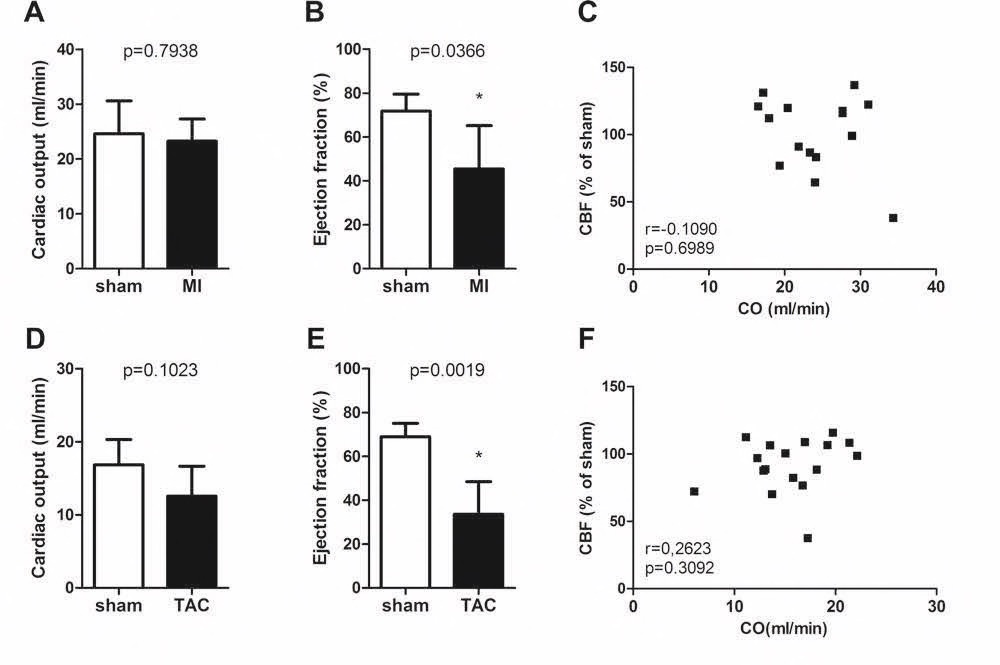
Chapter 6 Figure 2Cardiac function and correlation between cardiac function and cerebral blood flow in MI C57Bl/6 (A-C; n=4, 11) and TAC LDLr-/- mice (D-F; n=5, 12) 12 weeks after surgery. Although the MI and TAC mice did not display a reduced cardiac output (CO) 12 weeks after surgery (A, D), they showed a reduced ejection fraction 12 weeks after surgery (B, E). There was no correlation between the cardiac output and the CBF (C, F). * p<0.05 is significant
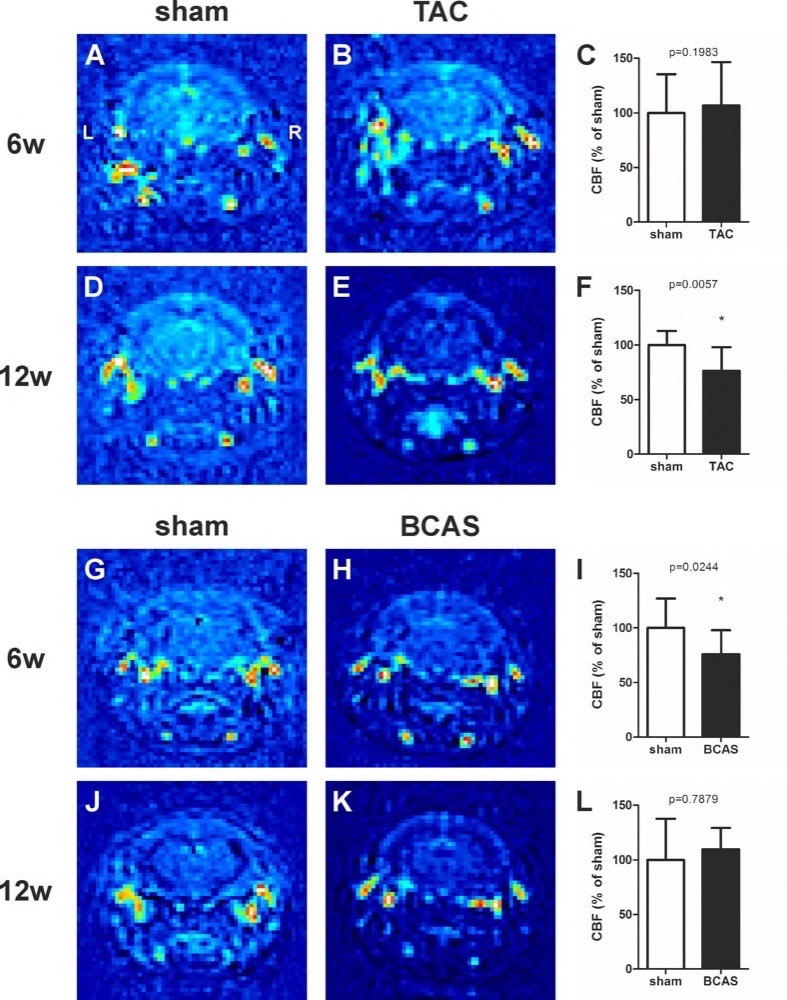
Chapter 6 Figure 3Representative MRI scans and graphs of CBF changes in TAC LDLr-/- mice at 6 weeks (6w) (A-C; n=11, 14) and 12 weeks (12w) (D-F; n=5, 12) and in BCAS C57Bl/6 at 6 weeks (G-I; n=9, 9) and 12 weeks after surgery (J-L; n=4, 7). The range of values from low (dark blue) to high (red) are relative to the background. * p<0.05 is considered significant.

Chapter 6 Figure 4Representative images of the white matter integrity (corpus callosum) for the Luxol fast blue (LFB) staining (A-E) are shown of the different mouse models. Graphs of changes in MBP staining (F-I) 12 weeks after surgery are shown for the MI C57Bl/6 (F; n=4, 12), MI APP/PS1 (G; n=5, 9), TAC LDLr-/- (H; n=9, 13), BCAS C57Bl/6 (I; n=7, 7) mice. x p<0.05 is considered significant.
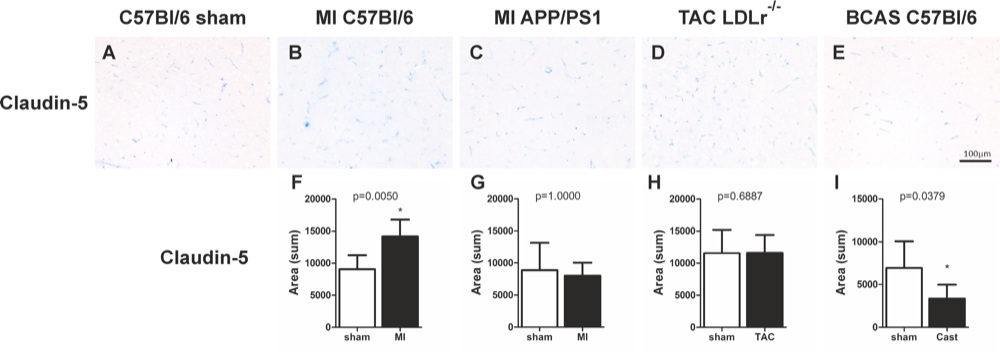
Chapter 6 Figure 5Representative cortical images of the tight junction marker claudin-5 (A-E) are shown of the different mouse models. Graphs of changes in cortical claudin-5 expression (F-I) 12 weeks after surgery are shown for the MI C57Bl/6 (F; n=4, 12), MI APP/PS1 (G; n=5, 9), TAC LDLr-/- (H; n=9, 13), BCAS C57Bl/6 (I; n=7, 7) mice. * p<0.05 is considered significant.

Chapter 6 Figure 6Cortical bleeding (A) (2,5x) and thalamic bleeding (B) (10x) in a TAC LDLr-/- mice 12 weeks after surgery. A cortical infarct was identified in one of the BCAS C57Bl/6 mice 6 weeks after surgery as shown in the overview picture of the HE staining (C) (2,5x) and a higher magnification (D) (10x) containing reactive microglia as shown with Iba-1 (D*) (10x). Absence of evident astrogliosis (E) (10x, GFAP) and microglial activation (F) (10x, Iba-1) in the optical nerve of a sham-BCAS mice as observed in most animals. Reactive astrocytes (G) (10x, GFAP) and microglial activation (H) (10x, Iba-1) were present in the optical nerve in some of the BCAS C57Bl/6 mice. A focal lesion was observed in the CA1 in one of the BCAS LDLr-/- mice 4 weeks after surgery (I) (10x) containing reactive microglia (J) (10x).
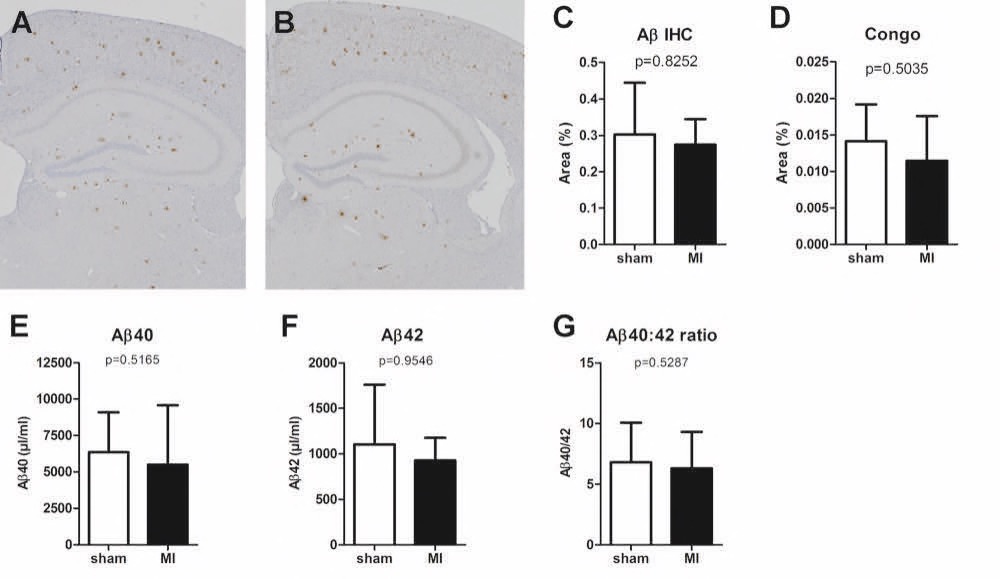
Chapter 6 Figure 7Representative images of the amyloid beta (Aβ) sections in APP/PS1 sham (A) and MI mice (B). No significant differences were detected between sham and MI APP/PS1 mice in Aβ IHC staining (C, n=5, 9), Congo red staining (D, n=4, 9), Aβ40 plasma levels (E, n=6, 9), Aβ42 plasma levels (F, n=6, 9) or the ratio between Aβ40 and Aβ42 plasma levels (G, n=6, 9).

Chapter 6 Figure 8Representative images of the cortex of GFAP (A-E) and Iba-1 (F-J) stainings and graphs of GFAP (K-N) and Iba-1 (O-R) changes in sham-BCAS C57Bl/6 (A, F), MI C57Bl/6 (B, G, K, O; n=4, 12), MI APP/PS1(C, H, L, P; n=5, 9), TAC LDLr-/- (D, I, M, Q; n=9, 13), BCAS C57Bl/6 (E, J, N, R; n=7, 7) mice at 12 weeks after surgery. * p<0.05 is considered significant.

Chapter 6 Supplemental Figure 1Coronal section of the Paxinos mouse brain atlas.78 Histological sections were taken in and around this area. The sections contain the following structures: cortex, corpus callosum, hippocampus, thalamus, hypothalamus, optical nerve, caudal caudate putamen and internal capsule. Regions used for histological analyses using photomicrographs (20x) of the CA1, dentate gyrus (DG) and cortex are indicated by black boxes.

Chapter 6 Supplemental Figure 2MRI artefact 0.18 mm BCAS coil. Piano wire 0.18 mm coils were inserted bilaterally on the common carotid arteries which created a blooming artefact (black) on a gradient echo MRI image.

